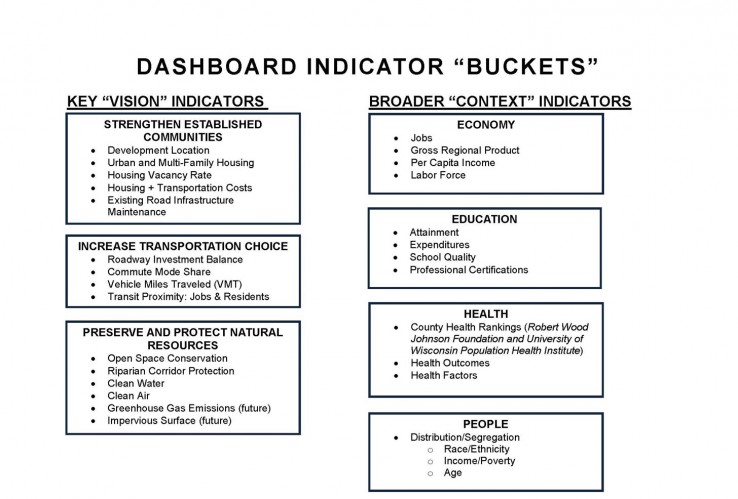
The dashboard contains 7 “buckets” of indicators
- 3 key “vision” buckets of indicators tied to vision themes
- 4 broader “context” buckets of indicators that are important to the Working Group and public, but not directly tied to vision
- 54 total indicators
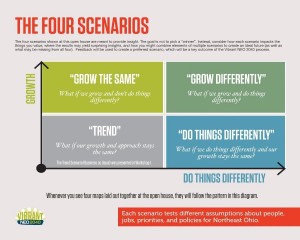
The key indicators address a full range of issues of regional concern, but they are bound by data availability and the scope of the project. The focal areas (or “buckets”) of Vibrant NEO 2040 are: strengthen established communities, increase transportation choice and protect agricultural and natural heritage. All key indicators are considered primarily at the regional scale. The key indicators derived from the spatial analysis used to illustrate four potential future scenarios for Northeast Ohio (Trend, Do Things Differently, Grow the Same, Grow Differently):
- Trend: Population and Job Growth until 2040 reflects 1990-2010 rates (very slow); policies and practices essentially unchanged
- Do Things Differently: Population and Job Growth until 2040 reflects 1990-2010 rates (very slow); policies and practices changed to prioritize compact new development in urban areas; increase transportation options and preserve open space.
- Grow the Same: Population and Job Growth until 2040 captures “fair share” of U.S. population (moderate); policies and practices essentially unchanged
- Grow Differently: Population and Job Growth until 2040 captures “fair share” of U.S. population (moderate); policies and practices changed to prioritize compact new development in urban areas; increase transportation options and preserve open space.
The values of these indicators helped stakeholders distinguish each scenario from the others, so stakeholders could more clearly differentiate the impacts of current choices on the region’s future. Other indicator “buckets,” such as economy, education, health and demographics, while critically important and bring regional context, are not direct measures of future scenarios.
Just as broader ecological health often reflects the health of key indicator species, improvements in almost any of the key indicators would result in improvements in economy, education, health and integration. Enhancing and diversifying transportation options would increase walking, biking and transit ridership. An integrated approach to land use and transportation planning would provide employees more options for getting to and from work and would enable more students to walk to school. More diverse housing options would likely encourage better integration of various population sub-groups. Reducing outward migration would help protect the region’s sensitive ecosystems and watersheds, as well as reduce vehicle miles traveled (VMT). These changes would likely improve air and water quality, and ultimately, better health outcomes. Most of the elements of the draft regional vision relate to regional economic competitiveness, educational opportunity and achievement, public health and population integration in some way.
The indicators for the draft regional vision depend on current data availability. Existing data sources that are updated regularly are referenced where possible. Noted are possible indicators that could be added in the future, if data were to become available. These indicators and targets draw heavily on the results from the alternative scenarios as a way to bound future possibilities. The Trend shows the likely future value of an indicator in 2040 if current development trends and patterns continue. The alternative scenarios show outcomes that might result from different policy decisions and growth trajectories. Linking the targets to scenario outputs also allowed public feedback to heavily influence target selection. Feedback gathered at the workshops shows a significant preference for the “Do Things Differently” and “Grow Differently” scenarios.


