The spreading out of Northeast Ohio’s population has occurred in tandem with an increase in lower density development. The options for meeting the transit needs of residents from areas of low-density development are different from residents from high-density areas. Public transit is most effective and efficient when serving high-density areas. Transit in low-density areas requires more routes to reach fewer riders. As a result, lower density development leads to an increased dependence on private automobiles.
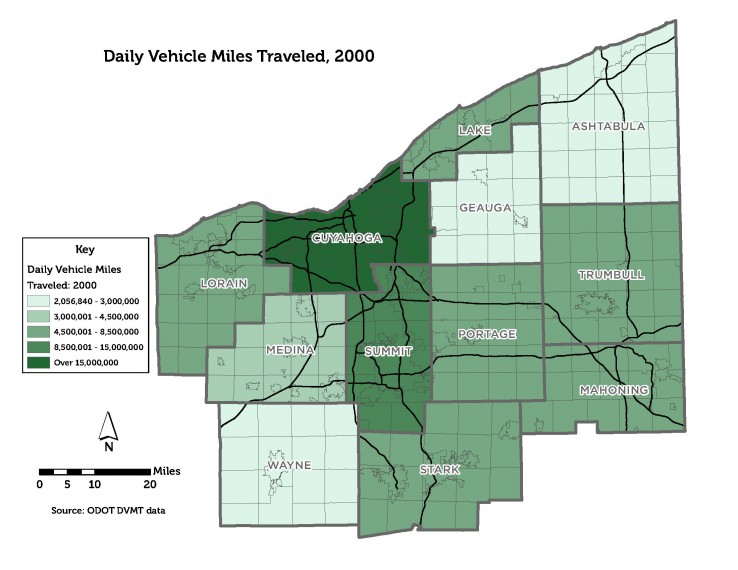
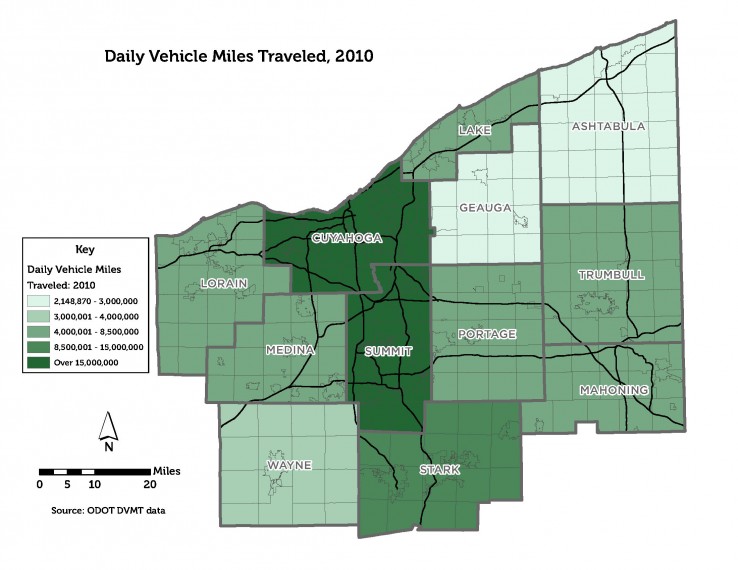
Daily Vehicle Miles Traveled, 2000-2010
These maps show by county how the daily vehicle miles traveled (DVMT) by Northeast Ohio’s residents have changed from 2000 to 2010.


DVMT increased sufficiently to move four counties – Medina, Wayne, Summit, and Stark counties – into higher categories of miles. In 2000, only Cuyahoga County experienced more than 15 million daily vehicle miles traveled. By 2010, Summit County had joined Cuyahoga County in the highest category of DVMT. Only Geauga and Ashtabula counties maintained their position in the lowest category of DVMT from 2000 to 2010.
As this table below illustrates shows, the majority of the region drives alone to work. Single-occupant personal vehicles are the primary form of travel in Northeast Ohio and they cause congestion, especially during rush hours and along heavily traveled corridors, such as I-76, I-77, I-271, and I-480. Commute time to work on average has increased.
| County | Drive Alone % |
| Lorain | 84.5% |
| Medina | 86.3% |
| Wayne | 78.7% |
| Cuyahoga | 79.2% |
| Summit | 86.1% |
| Stark | 85.4% |
| Lake | 86.8% |
| Geauga | 80.4% |
| Portage | 83.5% |
| Ashtabula | 83.9% |
| Trumbull | 86.7% |
| Mahoning | 86.5% |
Percentage of Drive Alone Trips by County Source: 2005-2009 ACS
Visit the Connections section of our Conditions and Trends Platform to learn more.

